
One thing you must know about trend-following is that even during great periods, the financial and emotional swings can be significant.
Take 2008 as an example. Trend-following performed very well overall when many asset classes got crushed. While you may remember the annual result being stellar, you may not remember the frequent and steep drawdowns throughout the year.
So, let’s walk through the daily performance of 2008. Looking back, you may think it’d be easy to live through that time — because you would’ve made so much money in trend-following. But this exercise may change your mind. As a trend-following proxy, we use a simple and aggressive trend-following system that trades several dozen instruments in a long and short manner. A classic trend-following approach.
I also want to preface this walkthrough by saying that before you invest in anything — whether it be in a particular strategy, asset class or manager — to please do your homework on the return characteristics you might expect over time [volatility, drawdowns, correlation to other investments, etc]. The last thing you want is to get in over your head and let a normal run-of-the-mill drawdown force you panic for the exit at exactly the wrong time.
OK let’s take a look.
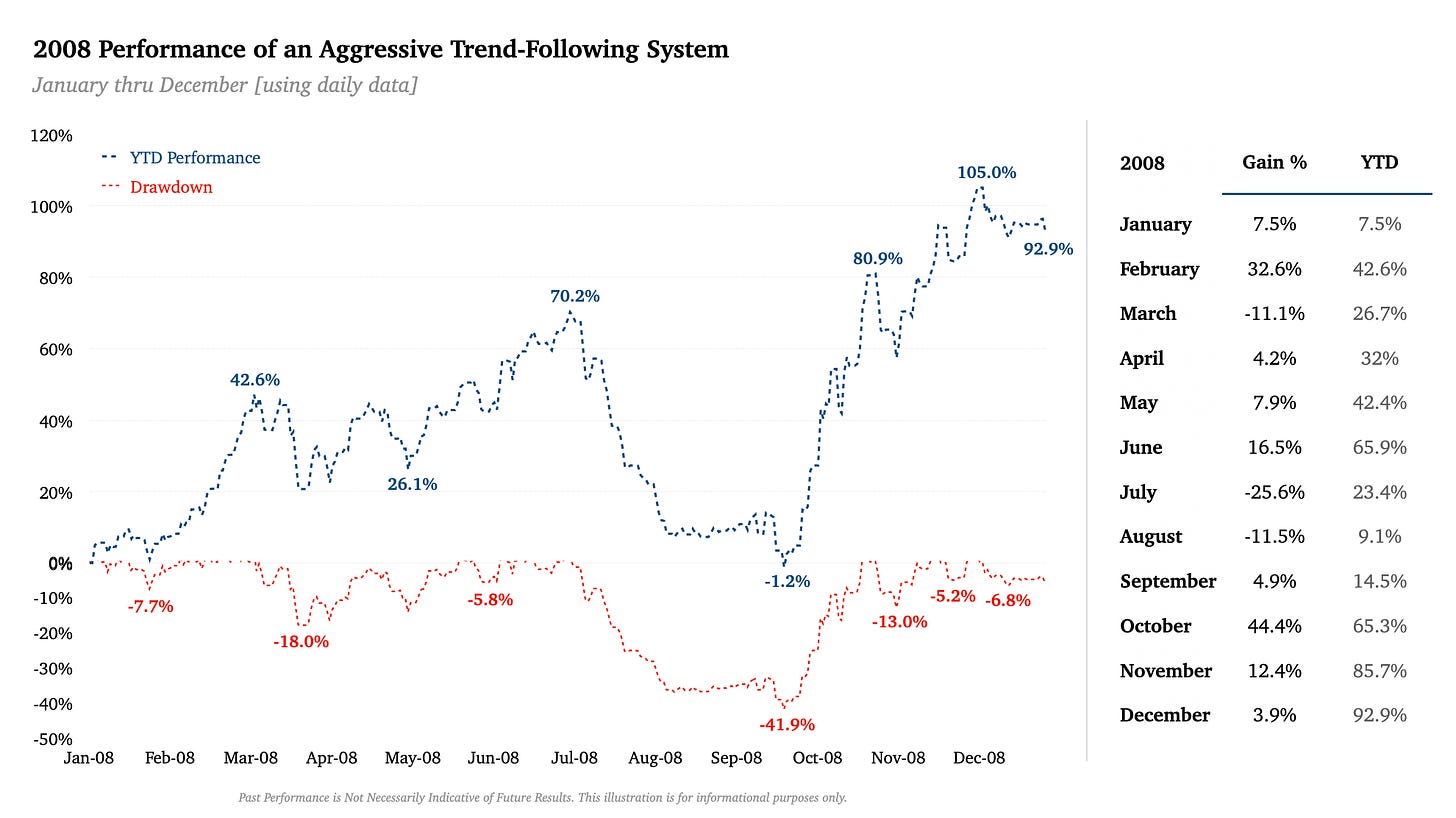
If you only looked at year-end figure, you’d likely be thrilled. But, as you can see, the ride to a 92.9% gain was anything but smooth.
At the end of Q2, you might be yelling “Life is good” and “I love trend-following” from the rooftops. The system, at the halfway mark, returned +65.9% while only experiencing an -18.0% drawdown.
Enter Q3. YTD performance sat at a stellar +70.2% on July 2nd. Then over the next 59 days, the system gave up ALL of the year’s gains to actually close slightly negative for the year (-1.2%) on September 22nd.
I repeat: all of the gains. From +70.2% YTD over the first 130 days to -1.2% YTD over the next 59.
How are we feeling now? Life still good? Still loving trend-following? Are you encouraging your manager to stick with his system or are you asking him what’s wrong with it? Did you throw up all over yourself?
Feeling the heat, even if you’re fully committed and confident in the investment, is completely normal. This system is definitely on the more aggressive side. Not everyone can stomach volatility like this, but this is a good exercise to get in touch with how you’d feel with the ups and downs — even in strong trending periods. But make no mistake, there is no substitute for living through it.
What can we learn from this exercise?
Trend-following systems are designed to take a punch. In order to capture those often-unpopular very large sustained moves, trend-followers are willing to give back profits and to get back into trades after a string of whipsaws. Q4-2008 is proof positive of the importance of accepting and embracing these two characteristics.
Profits and losses are unpredictable. The system includes the rules and the willingness to follow the rules. The rules do not guarantee profits. They do not foresee future trends. They adapt to and position with current trends. We never know when good and bad periods will start and stop.
Profits can cluster in a small amount of time. If you’re unfamiliar with trend-following, you might view the large Q3 drawdown as an impossible task to claw back out of. You may not have the confidence to stick with it, especially if the manager doesn’t tell you what you want to hear. In our example, it took only 31 days for the system to reclaim the July 2nd highs — a gain of +80%.
Watching the news isn’t necessary. Price data is the only input classic trend-following systems use. No fundamentals. No tips from FinTwit or your friends in finance. No need to subscribe to any financial publications or dissect Fed meetings and jobs reports. It can take a while to accept that price is all you’d need to produce performance like this. It can take even longer to embrace it, especially when you go through periods like Q3-2008.
Disclaimer: Past performance does not guarantee future results. The content of this essay is for informational purposes only. Charts show examples of trends. They do not serve as a recommendation to buy, hold or stay out.