Very few “Breaking News” flashes are actually that important. And almost none of them influence market trends in a meaningful way. The markets have likely been discounting this latest headline for a while now.
Deep down we know watching and listening to media all day long isn’t the way to win. It’s only to mask our feelings of boredom and FOMO, to make us appear busy, to make us feel like we’re actually doing something productive. We find it fun. We tell ourselves that it’s just a little hobby. No harm in that, right?
Hobbies typically satisfy some other deep desire. They aren’t for making money. Collecting old coins, restoring vintage cars, painting, gardening, building end-tables from reclaimed wood — all hobbies (that lose money) unless you actively engage in profitable trading.
Trading must not to be confused with a hobby. It’s for making money.
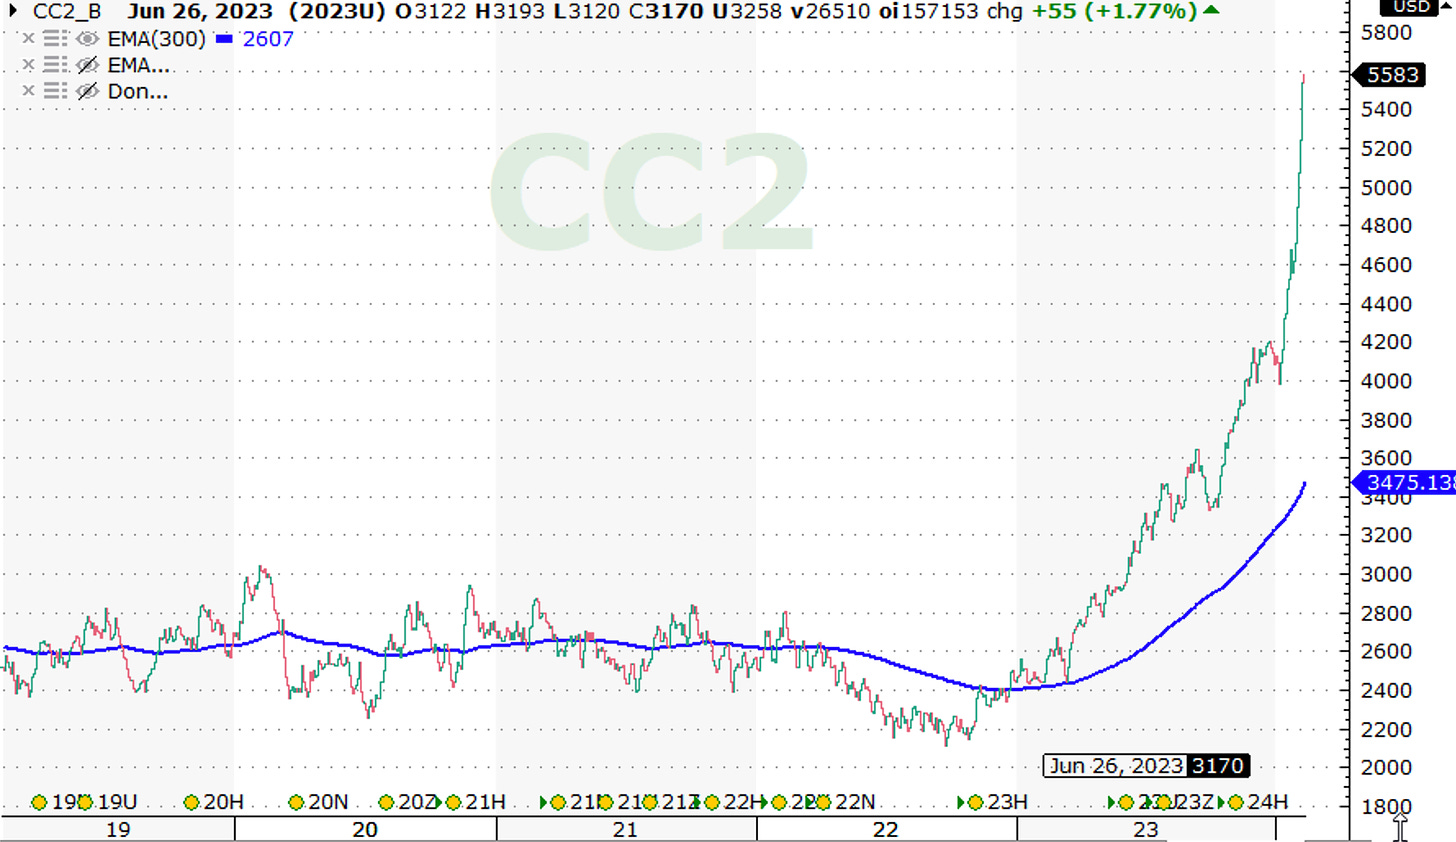
Over the last week or so, I’ve seen many people on LinkedIn and Twitter talking about cocoa prices.
COCOA PRICES SOAR TO MULTI-YEAR HIGHS!
INFLATION ISN’T DEAD! COCOA SAYS SO!
DESSERT JUST GOT MORE EXPENSIVE THANKS TO COCOA!
Prices have been trending up for a year now. A year. The recent parabolic increase is something to note, but this trend isn’t new. It’s old news to trend-followers and hedgers, the people who continuously pay attention.
Breaking news is only “breaking” for the people who haven’t been paying attention.
The Cocoa Bubble
I believe cocoa prices are currently in the bubble stage. Prices currently sit 60% above the 300-EMA. Historically speaking, that’s very high.
Prices can still increase for sure, but I think many people have caught on to the trend. And when a trend receives mass attention, the trend is close to the end. [Disclosure: Melissinos Trading and it’s clients hold a long position as of this post at 10:30aET on 2/13]
Examples of Other Bubbles
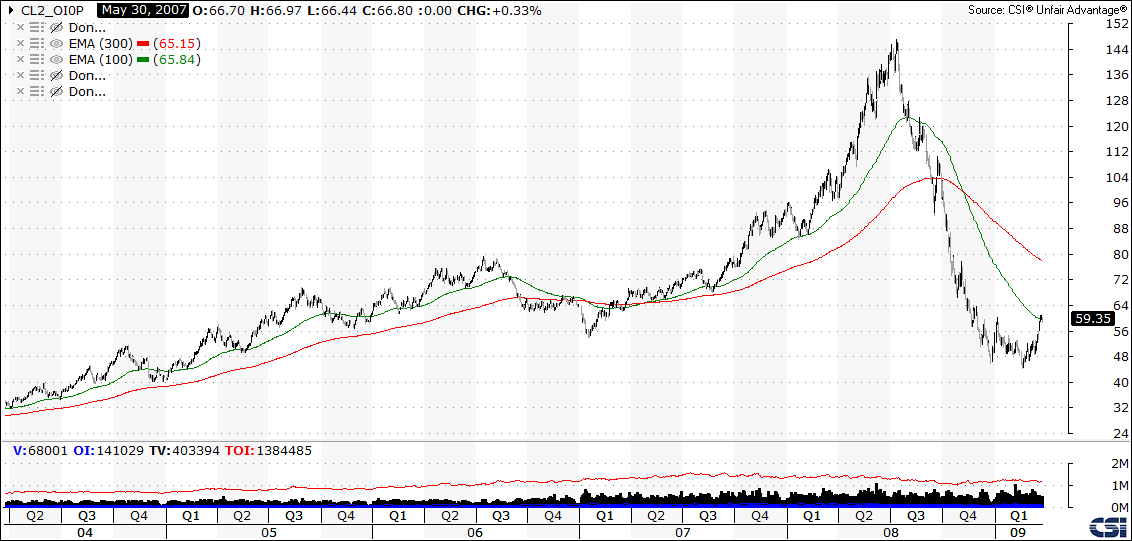
2008 Crude Oil
At the peak, prices sit 50% above the 300-day exponential moving average (EMA). Then prices collapse 70% over the following nine months.
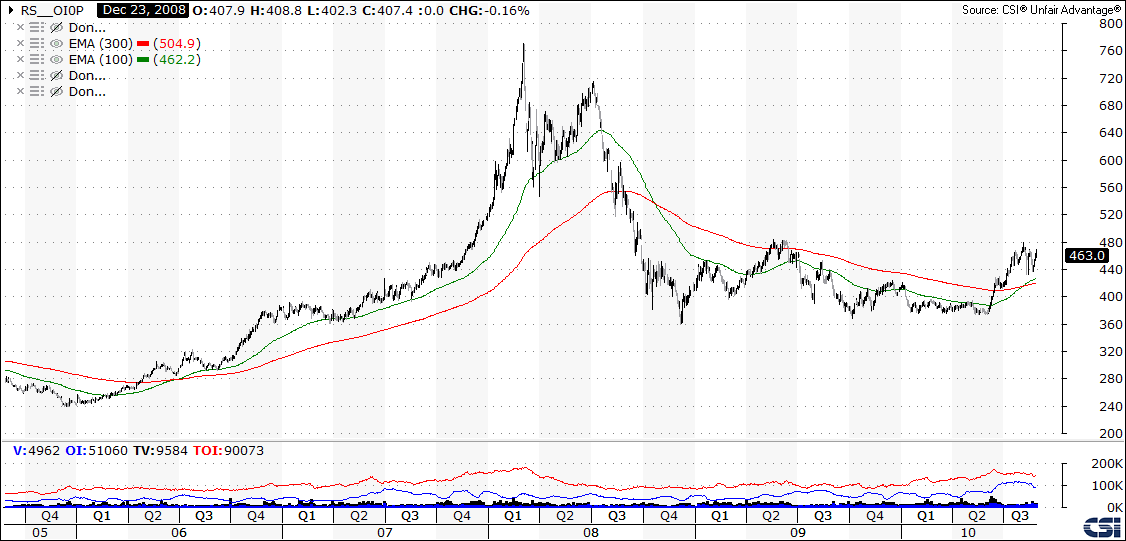
2008 Canola Oil
At the peak, prices sit 67% above the 300-day EMA. Then prices fall 53% over the following years.
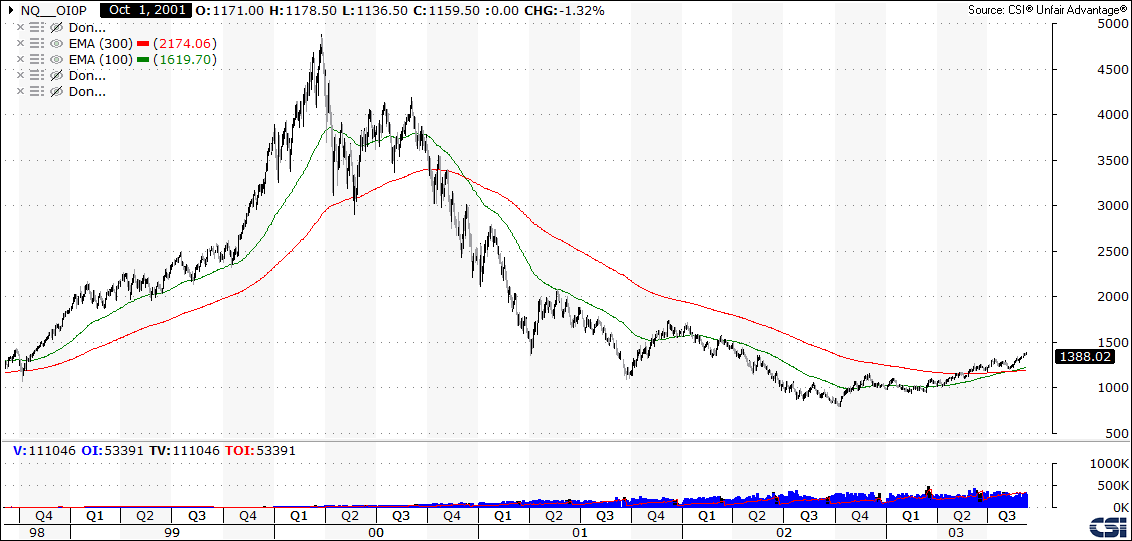
2000 Nasdaq
At the peak, prices sit 69% above the 300-day EMA. Then prices fall 84% over the following three years.
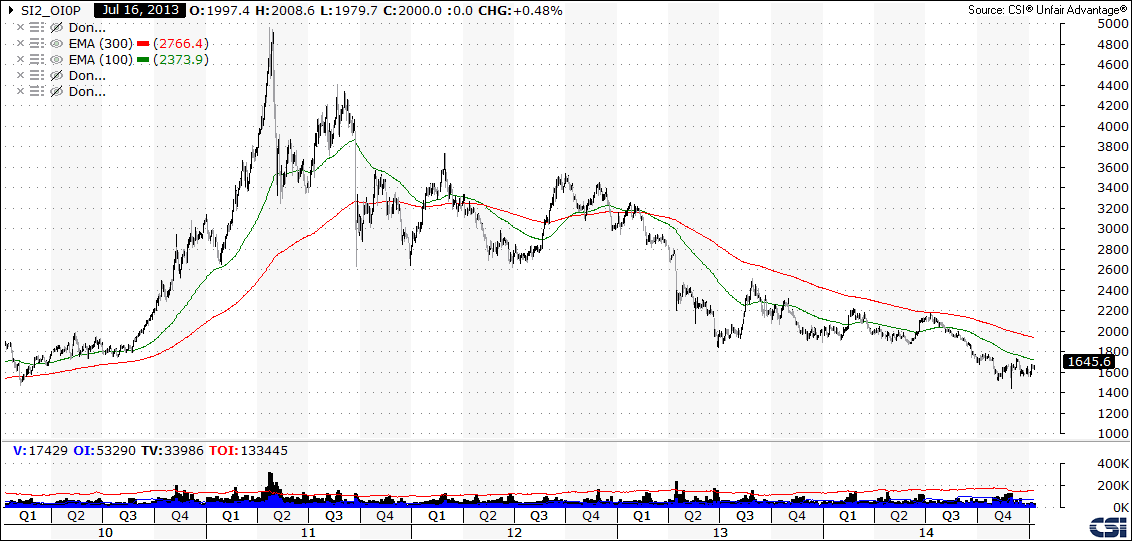
2011 Silver
At the peak, prices sit 85% above the 300-day EMA. Then prices fall 72% over the following years and still remains depressed today.
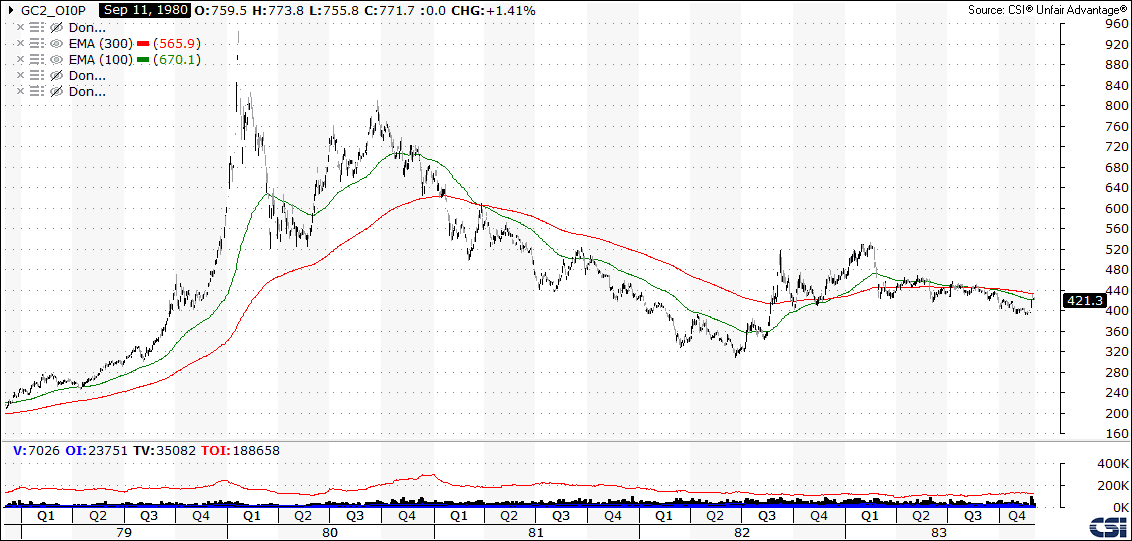
1980 Gold
At the peak, prices sit 150% above the 300-day EMA. Then prices fall 69% over the following years and remained depressed for a couple of decades.
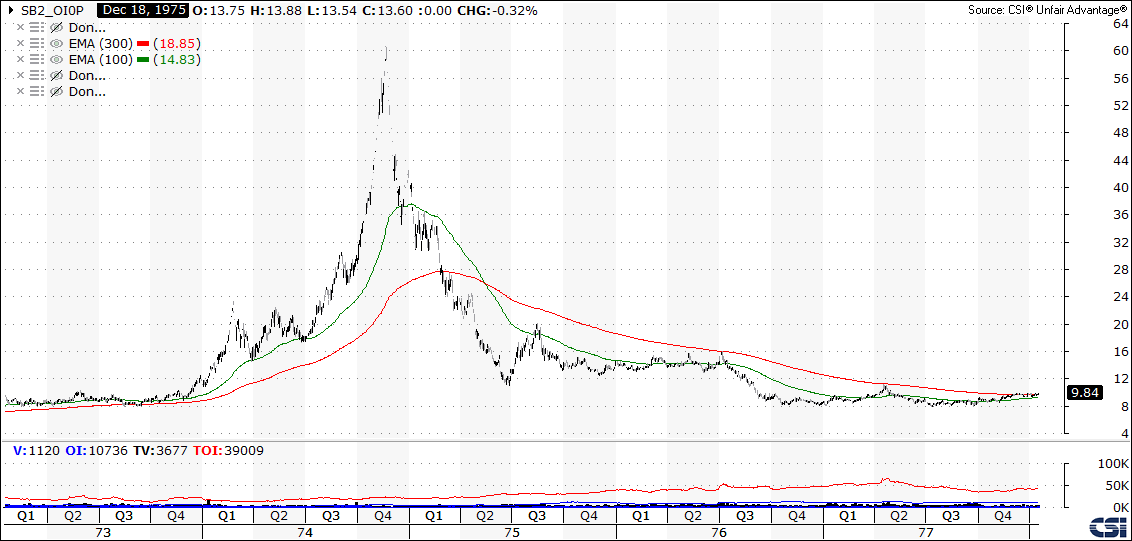
1974 Sugar
At the peak, prices sit 160% above the 300-day EMA. Then prices fall 87% over the following two years.
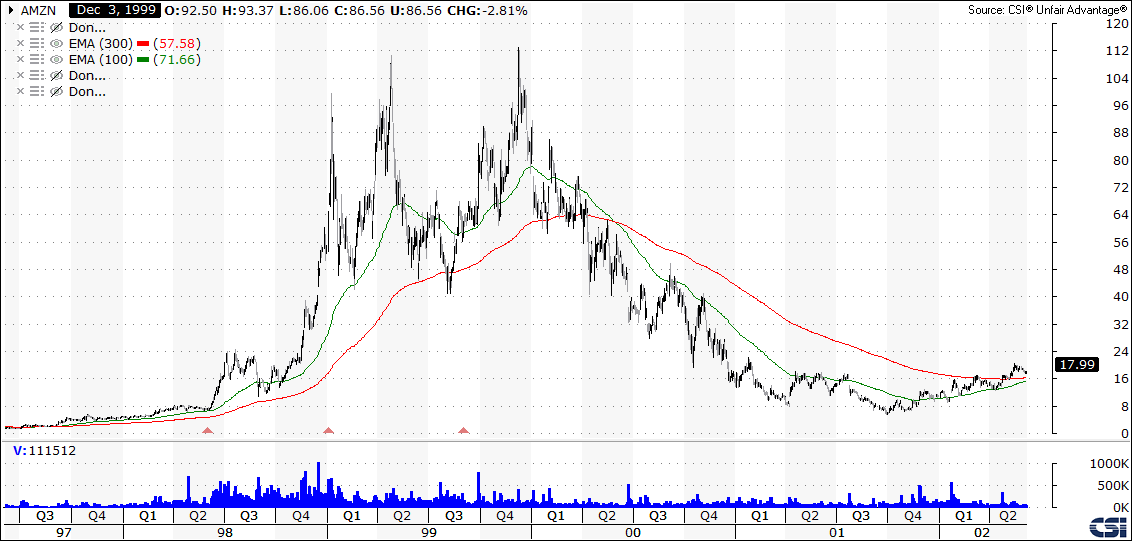
2000 AMZN
At the peak, prices sit 180% above the 300-day EMA. Then prices fall 95% over the following two years.
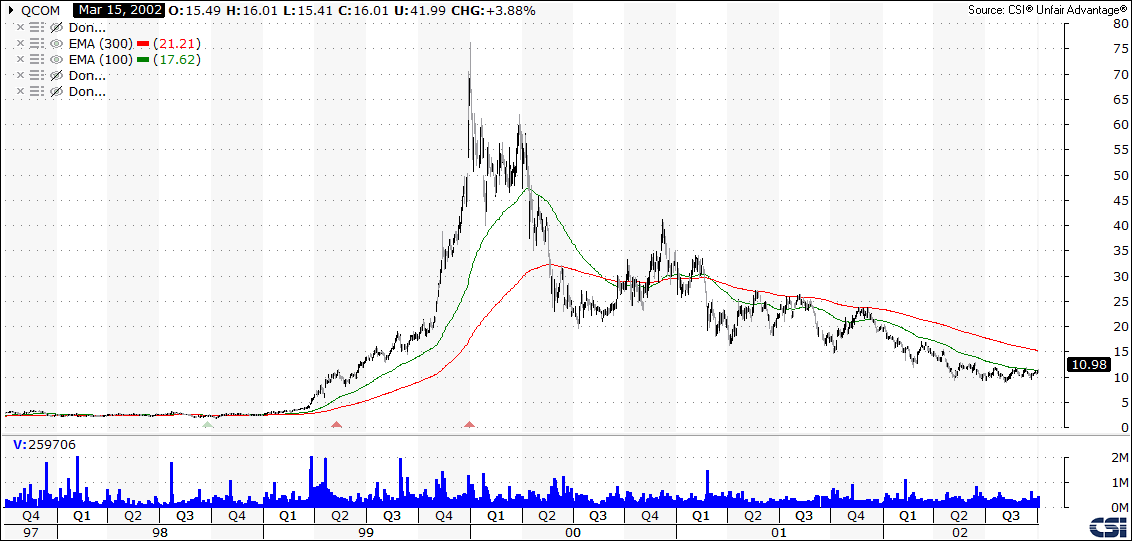
2000 QCOM
At the peak, prices sit 323% above the 300-day EMA. Then prices fall 88% over the following three years.
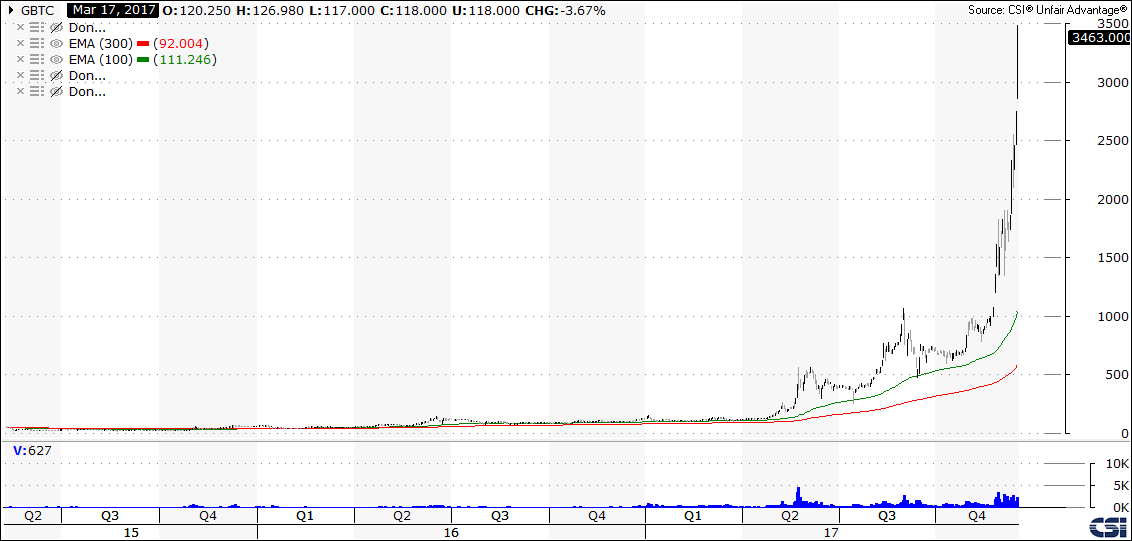
2017 Bitcoin
At the peak, prices sit 500% above the 300-day EMA.
Closing Thought
Bubbles excite a lot of feelings. They suck us in. We just want a piece of the action. But you must be careful. Bubbles are very dangerous to trade. The volatility is enough to make a man weep and call it quits.
Make sure you know what you can afford to lose both emotionally and financially before entering.

